Understanding and Troubleshooting Website Error Logs
For experienced web professionals, encountering website errors is a fact of life. Whether you're a seasoned developer, a vigilant system administrator, or a dedicated hosting provider, deciphering the cryptic messages within error logs is crucial for maintaining a healthy and functional website. This article serves as a guide to understanding, interpreting, and troubleshooting common website errors using your error logs, ultimately helping you ensure a seamless experience for your users.

What are Website Error Logs?
Website error logs are detailed records of events that occur on your web server, often indicating malfunctions or issues. These logs act as a virtual breadcrumb trail, allowing you to trace back issues to their source. They contain valuable information such as timestamps, error codes (like the infamous 404 or 500 errors), affected files or scripts, and even the IP addresses of users who encountered the errors.
Types of Website Error Logs
Depending on your server setup and configuration, you might encounter different types of error logs:
- Server Error Logs: These logs, typically found in locations like '/var/log/apache2/error.log' (Apache) or '/var/log/nginx/error.log' (Nginx), record server-side errors. They are essential for diagnosing issues with server configurations, missing files, or internal server errors.
- Application Error Logs: Many web applications, particularly those built with frameworks like Ruby on Rails, Django, or Laravel, maintain their own error logs. These logs are invaluable for debugging code-specific issues, database connection problems, or application logic errors.
- PHP Error Logs: As PHP is a widely used server-side scripting language, its errors are often logged separately. You can usually find these logs in your PHP configuration file (php.ini) under the 'error_log' directive.
- JavaScript Error Logs: For client-side errors occurring in your website's JavaScript code, you can utilize your web browser's developer console (usually accessed by pressing F12). These logs are essential for identifying and fixing JavaScript errors that might be affecting user experience.
Common Website Errors and Their Meanings
Understanding the meaning behind common error codes is crucial for effective troubleshooting. Here are a few examples:
- 404 Not Found: This indicates that the requested file or resource could not be found on the server. This could be due to a broken link, a mistyped URL, or an issue with file permissions.
- 500 Internal Server Error: This generic error message suggests a problem with the server itself, often related to server misconfigurations, coding errors, or resource limitations.
- 502 Bad Gateway: This error occurs when the web server, acting as a gateway, receives an invalid response from an upstream server, often indicating issues with your web server's communication with other services.
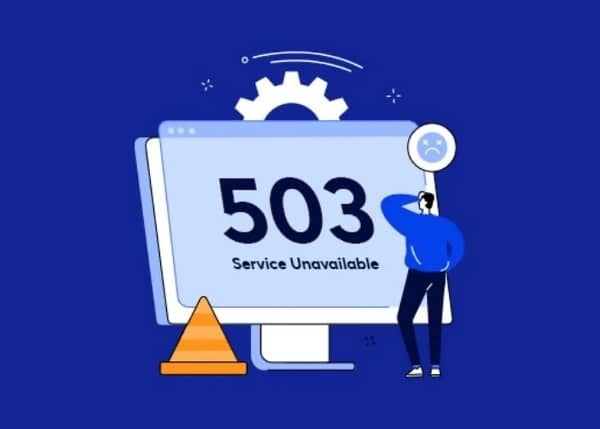
- 503 Service Unavailable: This indicates that the web server is temporarily unable to handle the request, potentially due to maintenance, overload, or resource constraints.
Tools for Accessing and Analyzing Error Logs
Accessing and analyzing error logs can be done through various methods:
- Command Line Interface (CLI): For server-side logs, using CLI tools like 'tail', 'grep', or 'less' allows you to view, filter, and search through log files directly on the server.
- FTP Clients: You can use FTP clients like FileZilla or Cyberduck to download error log files to your local machine for analysis.
- Web Hosting Control Panels: Many hosting providers offer built-in tools within their control panels (cPanel, Plesk, etc.) to easily view and manage error logs.
- Log Management Services: Services like Loggly, Splunk, or Graylog specialize in collecting, aggregating, and analyzing logs from various sources, making it easier to identify patterns and troubleshoot issues in complex web environments.
Best Practices for Error Logging and Troubleshooting
To maximize the effectiveness of your error logging and troubleshooting efforts, consider these best practices:
- Enable Detailed Logging: Ensure your server and application settings are configured to log errors with sufficient detail, including timestamps, error codes, and relevant context.
- Regularly Monitor Logs: Don't wait for issues to arise. Regularly review your error logs to proactively identify and address potential problems before they escalate.
- Use Log Rotation: Implement log rotation strategies to prevent log files from growing excessively large, which can impact server performance and make analysis cumbersome.
- Prioritize Security: Store your error logs securely and restrict access to authorized personnel to prevent sensitive information from being compromised.
- Utilize Monitoring Tools: Leverage automated monitoring tools or services that can alert you in real-time when specific errors occur, enabling you to react quickly and minimize downtime.


